
For situations where a chemical compound can exist in more than one crystalline form such as the common cases with geological phases like CaCO3 (calcite, aragonite and vaterite forms) and TiO2 (anatase and rutile forms), elemental information alone cannot determine the structural form. There are certainly cases when you might want the higher bandgap or hardness of one crystal structure versus another and do want to know which form is present in a material. But, while there are property and behavior differences amongst these compounds, the impact and value of polymorph identification is not always at the forefront of the testing decisions for these materials. There is however an industry where the identification of the polymorphs present is a vital part of the testing requirements, and the form can have drastic impacts on the material properties – pharmaceuticals.

Pharmaceutical Polymorph Identification
With active pharmaceutical ingredients (API) and excipients, the presence of a different polymorphic form can have strong influence on the resultant drug efficacy, solubility, stability, food reactions, melting point during processing, and the dissolution rate in the body. These important therapeutic reasons for understanding the polymorphic form of a drug substance are of such importance that regulatory agencies such as the U.S. FDA and others, strictly require the detailed identification of the polymorph during the development, testing, and submission of a drug. Secondarily, there are often very important patent and intellectual property ramifications that are tied to the polymorphic form of a pharmaceutical product. The development of a new polymorph can allow for inroads into the drug market for generic manufacturers without infringing on existing patents.
Determining Polymorphs
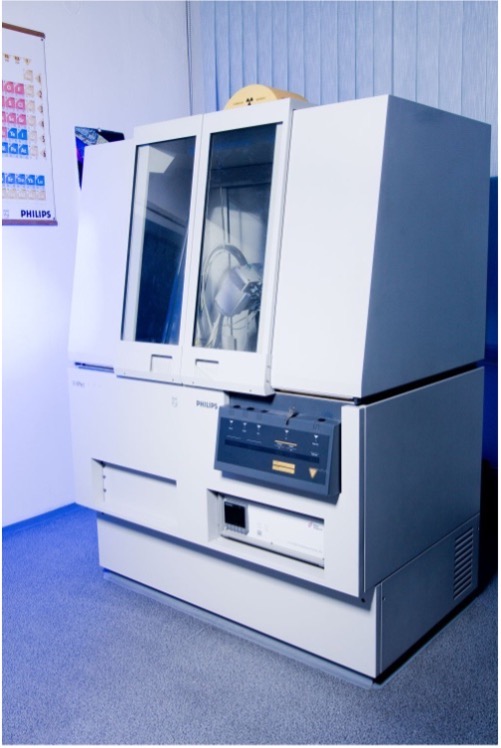
X-ray diffraction (XRD) is the primary technique for revealing the structural differences between the forms since it can identify the crystal structures of the phases present in a sample and provide a defining “fingerprint” of peaks that can be established to fully identify and reference one polymorph versus another. XRD, with the right information and samples, can be used on both a qualitative basis to identify polymorphs and a quantitative basis to determine the amount of each form present or establish an allowed detection or quantification limit of one form in the presence of another for example. There is much interest currently in the pharmaceutical field for developing new drugs with better bioavailability and less reactions with foods or other compounds. One popular method for achieving this is through the development of amorphous drugs, such as with research into amorphous solid dispersions. XRD can be used as a confirmational technique to show the absence of crystalline peaks which can indicate that the amorphization was achieved as desired.
Another technique of value in polymorph identification and understanding is differential scanning calorimetry (DSC). DSC is useful in determining polymorphs with different melting points, crystallization behaviors, phase transitions, or thermal stability. You can easily evaluate small amounts of sample and observe known transitions from amorphous to crystalline forms or from one form to another.
For all these reasons, XRD and DSC testing to identify polymorphs in your pharmaceutical products are technique worth adding to your toolkit and are areas of expertise where we at H&M Analytical can offer excellent results and service.
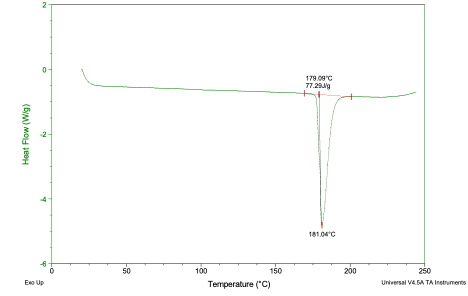
Figure 1 – DSC curve for the pure Form-A of the Pharmaceutical API.
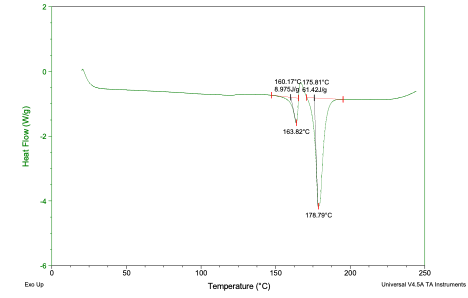
Figure 2 – DSC curve for the pure Form-B of the Pharmaceutical API Showing two distinct endotherms.
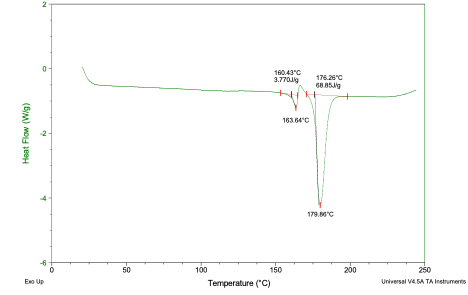
Figure 3 – DSC curve for a mixture of Form-A and Form-B of the Pharmaceutical API Showing two distinct endotherms, but a much smaller peak at ~164 degrees than the pure form-B, indicating the peak at ~180 is relatively larger due to overlap with the form-A peak at ~180 degrees.
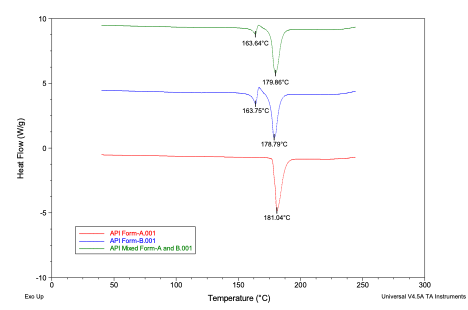
Figure 4 – Overlay of the plots of Form-A, Form-B and the mixture of the two forms.
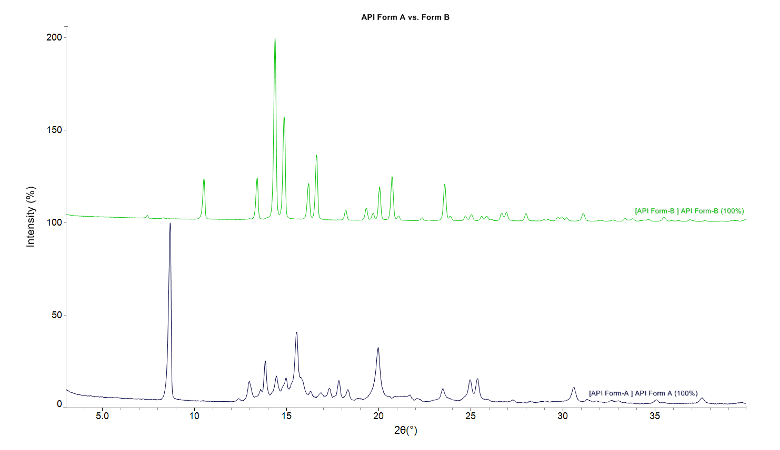
Figure 5 – XRD patterns for the pharmaceutical API showing the difference in polymorphic Form-A vs. Form-B.
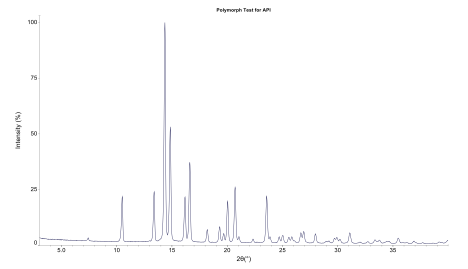
Figure 6 – XRD pattern for a test sample of the pharmaceutical API showing the sample is consistent with polymorphic Form-B when compared to the patterns of the pure forms shown in Figure 5.